


What does 101,561 runners taking part in the same 5k look like?
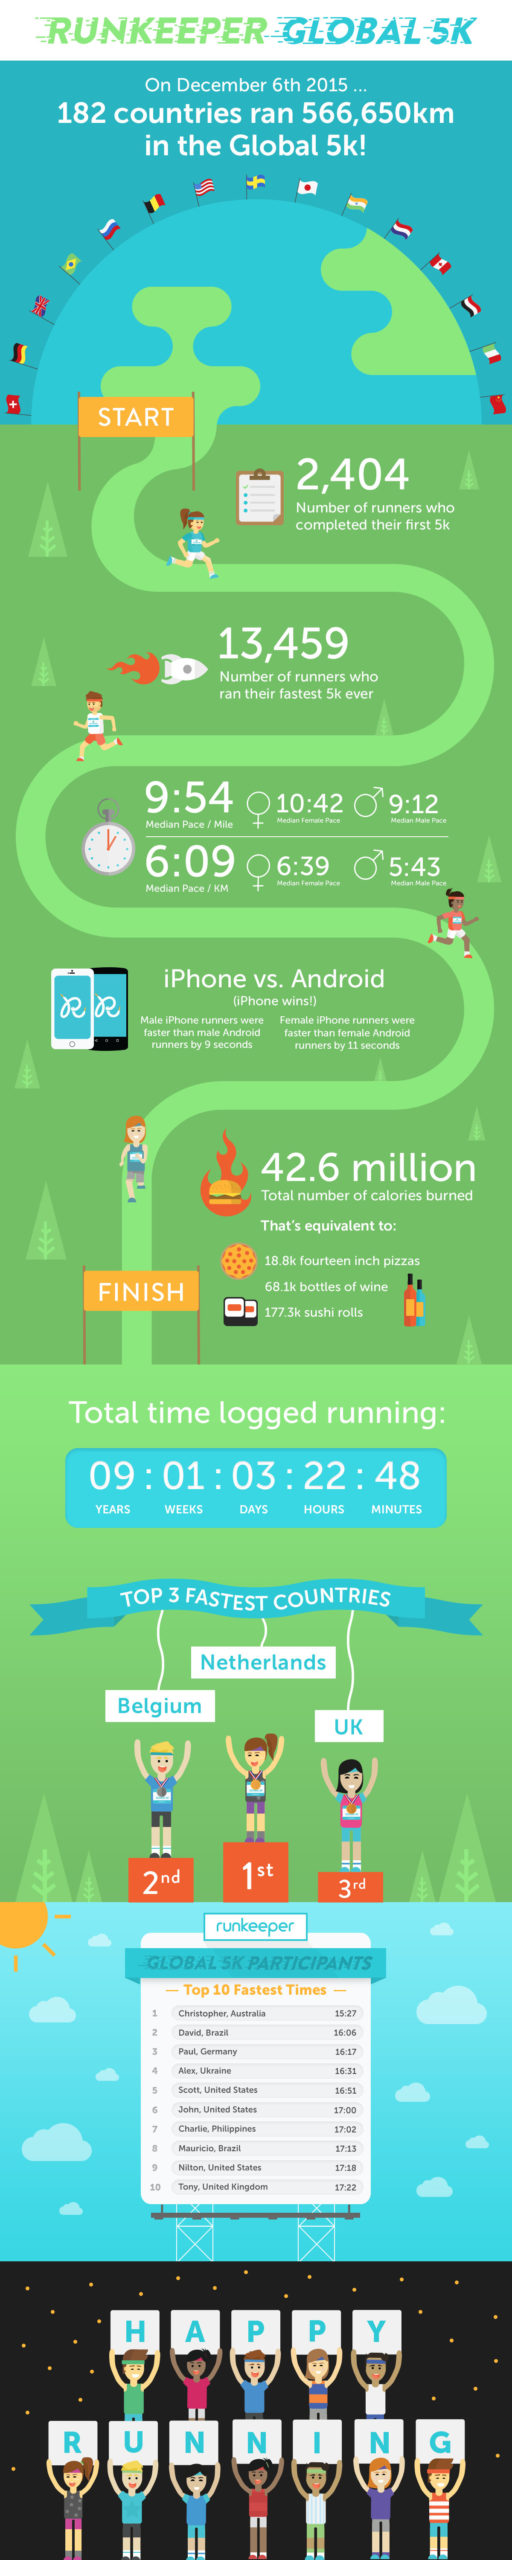
79,125 hours, or just over 9 years worth of running, tracked in a single day.
42.6 million calories, or in food terms: 18,800 fourteen-inch pizzas, 68,100 bottles of wine, or 177,300 sushi rolls. Yum!
13,459 personal best 5k times (that’s over 10% of participants!).
7,196 post-run photos (we’re betting lots of them were selfies).
4,200 runs shared to Twitter (and lots of great action with the #Global5k hashtag both there and on Instagram)
And that’s just the beginning! We’ve got lots more for you, captured in the infographic below. (Click here to open on a new tab and zoom in on it). Be sure to read below the graphic for added context!
Congrats again to all finishers!
Some notes on pace*
Overall, those who ran 4:02 per km (6:30 per mile) or faster were in the 99th percentile! A pace of 9:27 per km (15:12 per mile) would put you in the 10th percentile.
Take a look below at the overall fastest countries, and also pace broken down for male and females.** To answer our original question, yes, France IS faster than Italy.
Overall pace
- Netherlands (5:53 per km/9:28 per mi)
- Belgium (5:58 per km/9:36 per mi)
- United Kingdom (6:00 per km/9:40 per mi)
- France (6:02 per km/9:42 per mi)
- Italy (6:08 per km/9:52 per mi)
- Spain (6:08 per km9:53 per mi)
- Japan (6:08 per km/9:53 per mi)
- Germany (6:10 per km/9:55 per mi)
- Australia (6:10 per km/9:56 per mi)
- Canada (6:12 per km/9:59 per mi)
- Russia (6:14 per km/10:02 per mi)
- Sweden (6:14 per km/10:08 per mi)
- United States (6:19 per km/10:10 per mi)
- Brazil (6:31 per km/10:30 per mi)
- India (8:00 per km/12:53 per mi…must be all that traffic, yikes!)
Male pace
- Netherlands (5:29 per km/8:49 per mi)
- United Kingdom (5:33 per km/8:56 per mi)
- Belgium (5:37 per km/9:02 per mi)
- France (5:37 per km/9:03 per mi)
- Sweden (5:37 per km/9:03 per mi)
- Italy (5:39 per km/9:05 per mi)
- Canada (5:39 per km/9:06 per mi)
- Australia (5:41 per km/9:08 per mi)
- Japan (5:41 per km/9:09 per mi)
- Spain (5:42 per km/9:10 per mi)
- Russia (5:46 per km/9:17 per mi)
- Germany (5:47 per km/9:18 per mi)
- United States (9:20 per mi)
- Brazil (5:48 per km/9:35 per mi)
- India (7:07 per km/11:27 per mi)
Female pace
- Netherlands (6:17 per km/10:07 per mi)
- Belgium (6:20 per km/10:11 per mi)
- France (6:26 per km/10:21 per mi)
- United Kingdom (6:27 per km/10:23 per mi)
- Germany (6:33 per km/10:32 per mi)
- Spain (6:35 per km/10:36 per mi)
- Japan (6:36 per km/10:37 per mi)
- Italy (6:37 per km/10:39 per mi)
- Australia (6:41 per km/10:45 per mi)
- Russia (6:41 per km/10:46 per mi)
- Canada (6:45 per km/10:52 per mi)
- United States (6:50 per km/11:00 per mi)
- Sweden (6:58 per km/11:13 per mi)
- Brazil (7:05 per km/11:24 per mi)
- India (8:54 per km/14:20 per mi)
Who participated?
The top 15 countries for overall participation are captured in this leaderboard, but per your request, we also wanted to take a look at participation relative to country population. Sweden won this one, but Netherlands was a close second!

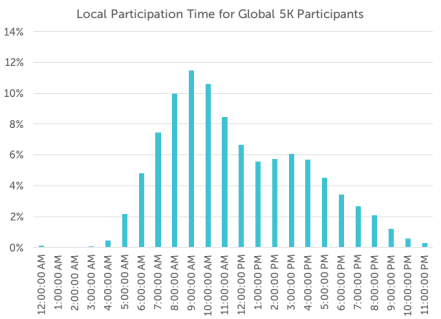
What time did everyone run?
While we saw runners out at every hour of the day and night, mornings we certainly most popular. Perhaps you were trying to simulate physical road races, which typically start in the A.M. The full distribution is below.
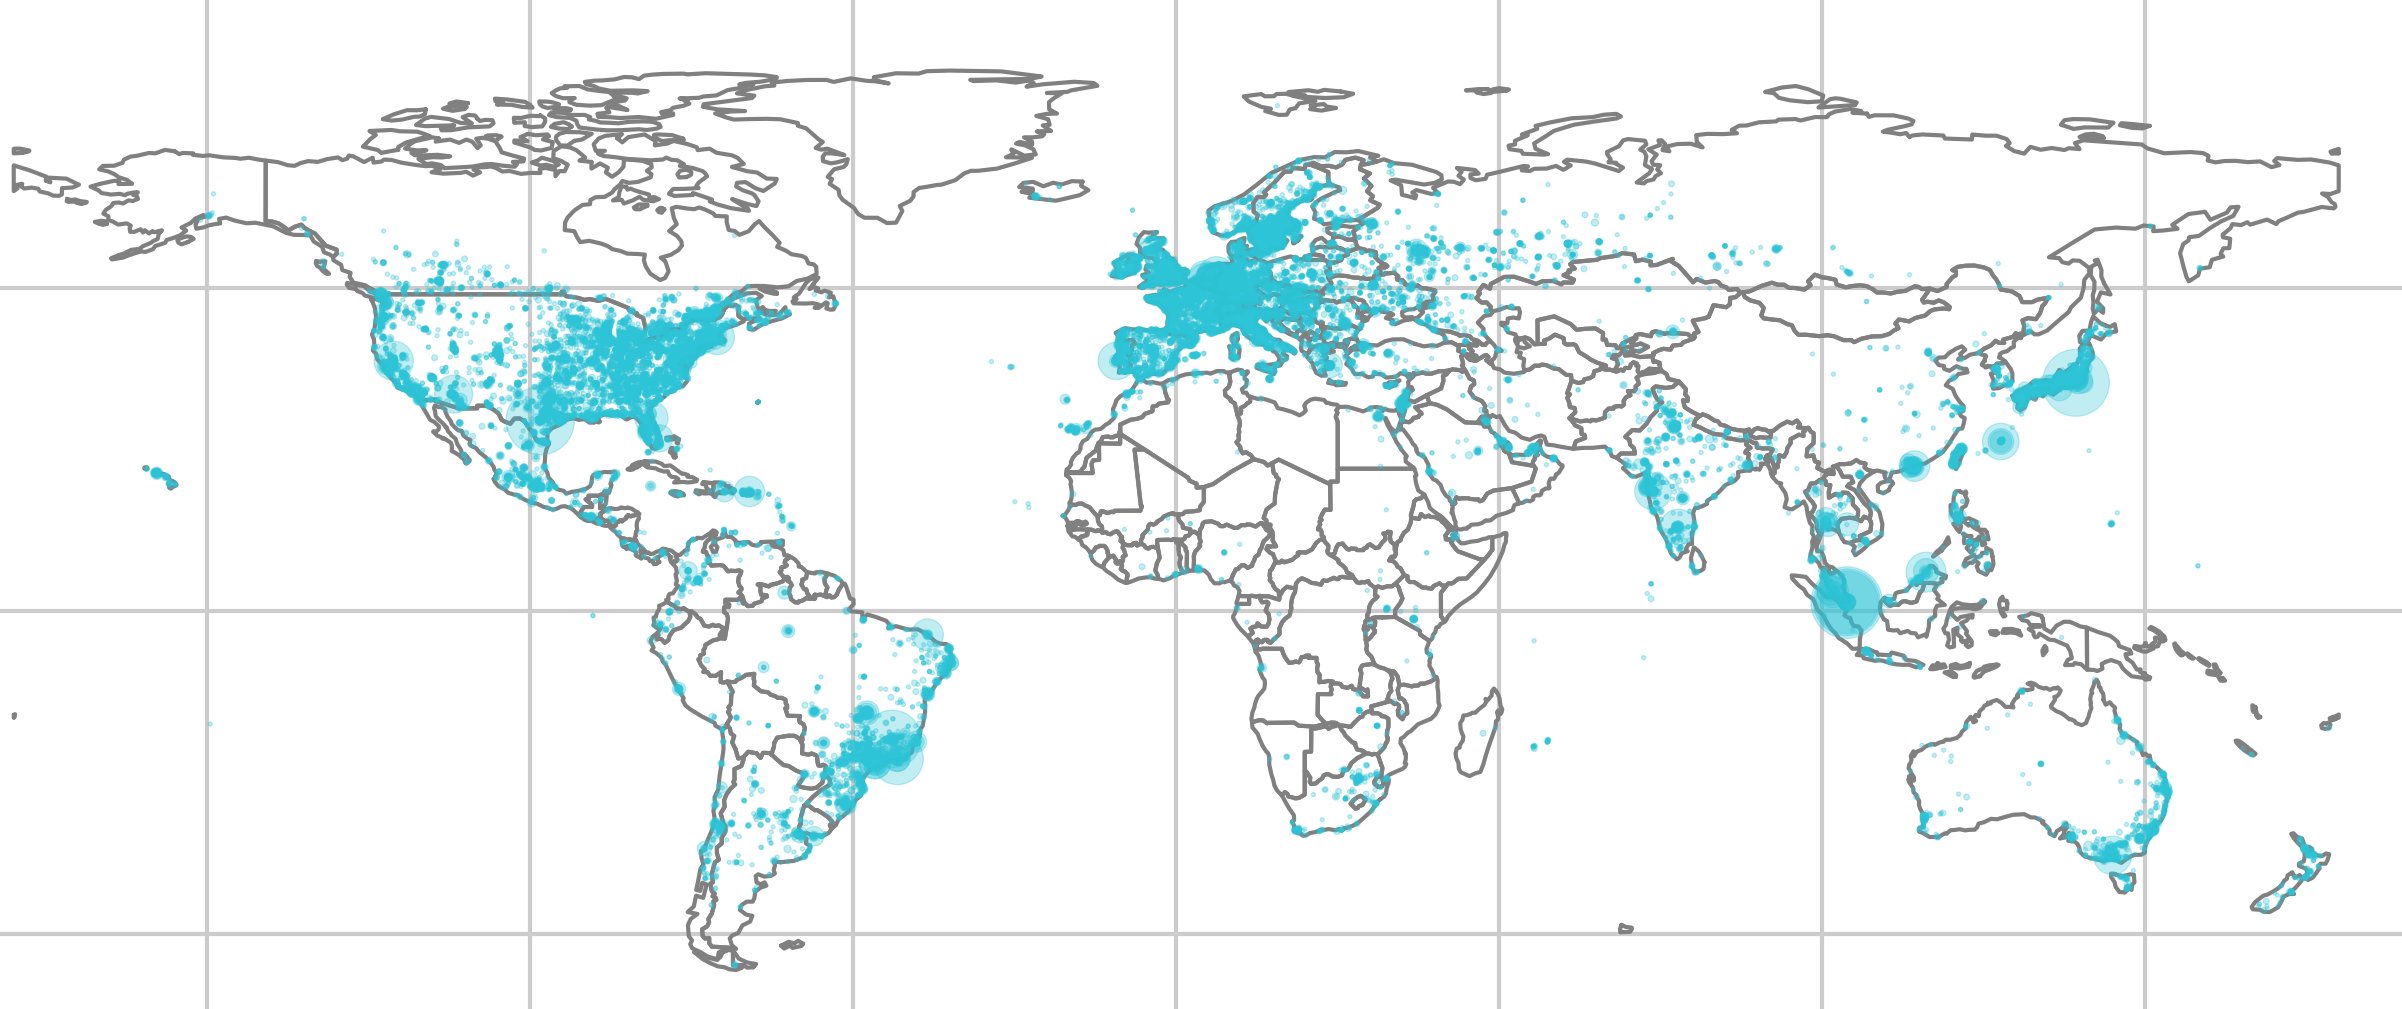
Where did they run?
This map below shows where around the world people got their runs in, with the bigger circles representing cities with lots of participation. Tokyo, London, Sao Paulo, Austin TX, and Hong Kong all stand out.
Footnotes
*We analyzed pace for the top 15 countries, as those provided a large enough sample size for fair analysis and comparison.
**For fairness we calculated the fastest overall paces by averaging male and female median paces.
***First and fastest 5ks in the infographic only reference those tracked in Runkeeper

